From pilot to profit: bridging the gap between AI adoption and business impact
Artificial intelligence (AI) is everywhere. Demos, pilots and eager teams. Yet the return on investment (ROI) is hard to find. Most organisations are experimenting, but few turn that effort into real AI adoption business impact on the profit and loss (P&L). Recent studies show about 95% of generative AI (GenAI) pilots do not move the P&L. Only 5% of custom tools reach production. (MIT NANDA, 2025) That is not a verdict on AI. It tells us our choices, measurement and scaling are not yet fit for the purpose.
Ciralgo’s view: the gap is mostly organisational, not technical. That’s why Ciralgo focuses on AI adoption analytics: mapping where AI is used, how it changes work and which use cases actually create business impact so you can scale with evidence, not intuition. When you measure adoption and link outcomes to each use case, scattered activity becomes evidence. You can see what to scale, what to stop and where the budget should move. Ciralgo’s AI adoption analytics platform maps where AI is used, what it costs and which workflows actually move the P&L, so these signals turn into action.
What the 95/5 split really means
Pilots often lift local productivity, yet the gains fade in production. Common causes are weak integrations, slow decision-making and widespread shadow AI usage. Top performers cut time to production to about 90 days. Many large enterprises take nine months or more which causes momentum to fade and ownership to get fuzzy.
Shadow AI use tells a similar story. Staff in roughly 90% of firms use personal AI tools, while only about 40% hold official licences. (MIT NANDA, 2025) If you run on Microsoft 365, we break this down in more detail in our guide on moving from shadow AI to a governed Copilot environment. If you only watch licensed dashboards you miss where work is actually changing, for better and for worse.
Measuring what matters
Across 840 G7 firms the most cited obstacle is the inability to estimate ROI in advance (62% of manufacturers; 56% of ICT companies). That leaves budget decisions in the dark. (OECD, 2025) AI value is often embedded in the work: fewer hand-offs, faster first drafts, less rework. Traditional cases miss that. Even in clear cases such as predictive maintenance, proving a cost you avoided needs historical data and gathering that data also costs money. (OECD, 2025)
Many teams lack baselines. No time to first draft. No rework rate. No prompt reuse. No view of duplicate tool spend. Qualitative gains appear first, but finance needs numbers to justify decisions. Counting pilots or prompts does not count as value to them. Executives expect euros per hour saved per role, cases per hour, errors avoided, external spend reduced, time to resolution and lead time to production.
How leaders are closing the gap
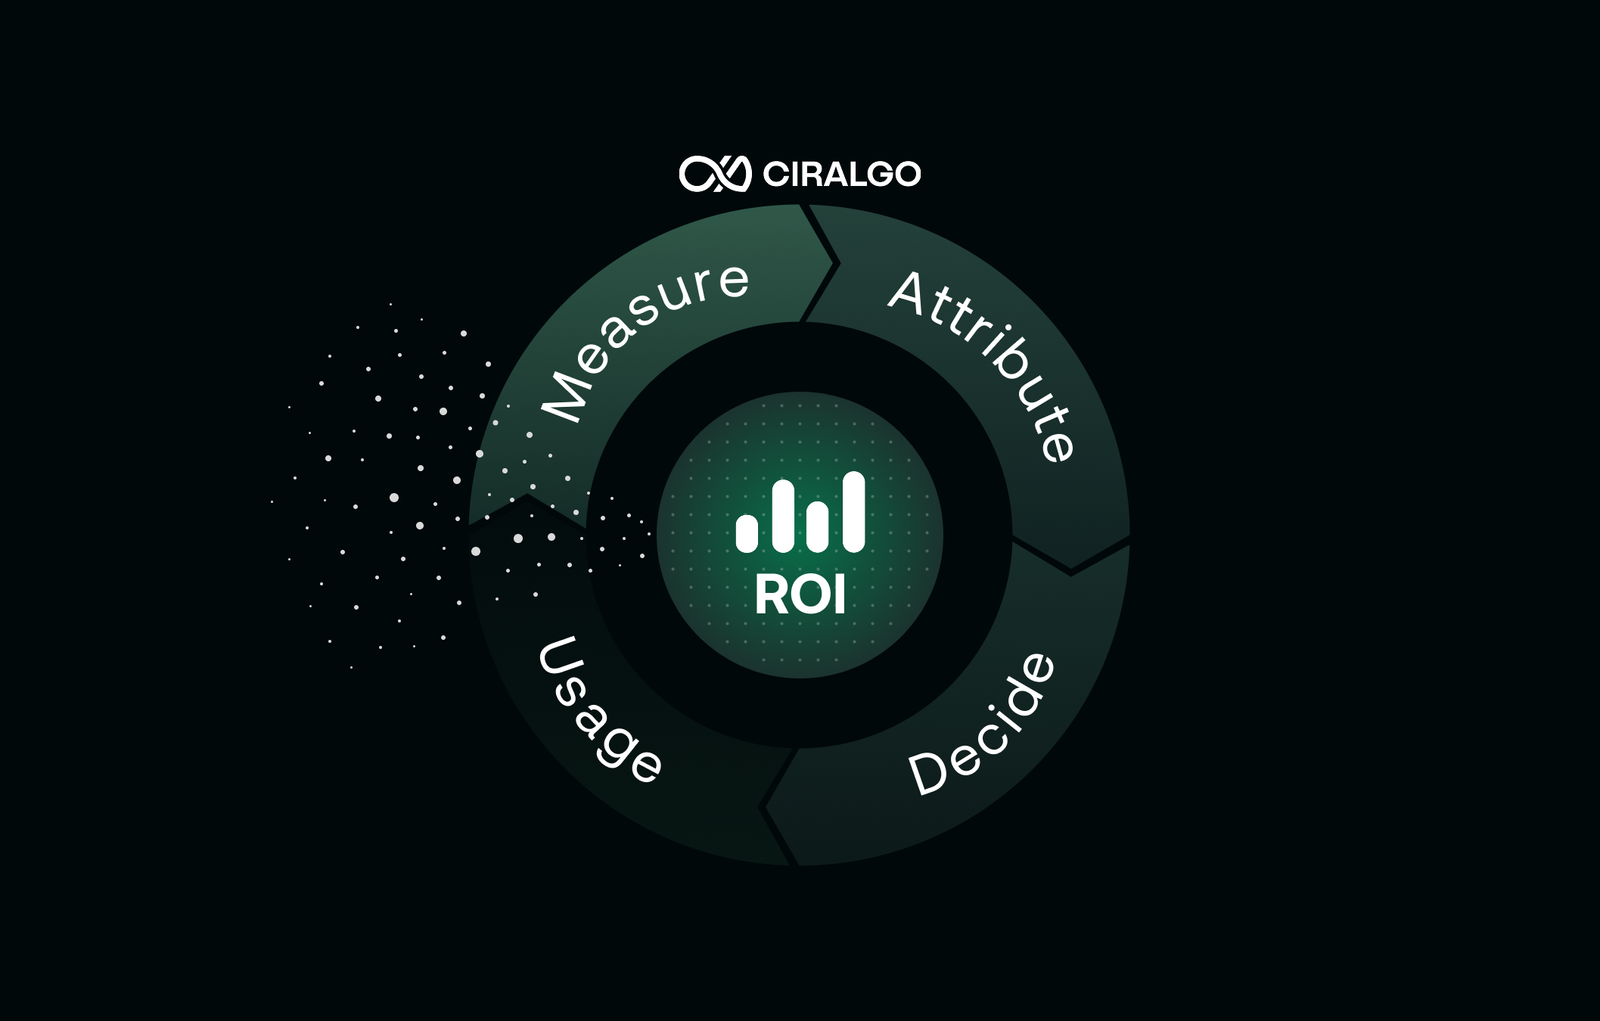
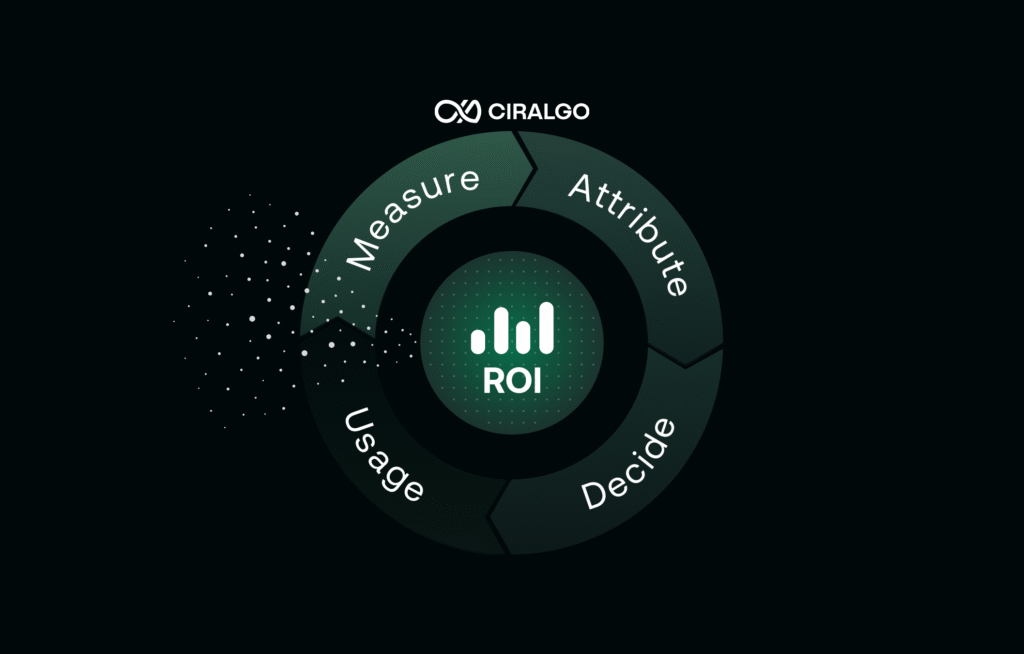
Public innovation agencies now frame ROI uncertainty as a symptom of data immaturity. The enterprise lesson is similar: stop guessing, measure work in a way that matches how work is done. Track signals close to the task, such as accepted AI suggestions per employee and like them to outcomes like minutes saved multiplied by volume and loaded hourly rate, error reductions tied to rework costs, or throughput gains against backlog. Attribute results to specific tools or prompts to avoid double counting and watch the added value over time because productivity gains can decay over time. The goal hereby is not perfection but reducing uncertainty to a point where the ROI of AI within an organization can be estimated accurately.
Shedding light on Shadow AI
You cannot measure what you cannot see. And right now, much of your AI activity is invisible to leadership. Reports show a striking gap: employees in ~90% of firms use personal AI-tools for work, while only ~40% of firms have official licenses. If you are looking at vendor dashboards for licensed tools you are missing where AI is actually changing work, good and bad. (MIT NANDA, 2025)
You may have useful workflows: pre-QA drafts, contract clauses, claim summaries, built with consumer tools. If you do not see them you cannot standardise or scale them. You may also pay twice for similar tools. Visibility lets you consolidate and renegotiate. A formal pilot may fail while an unofficial pattern quietly delivers lift. Legacy activity metrics do not see AI-assisted work. You need AI-specific signals to connect usage to outcome. A platform like Ciralgo gives you those signals by showing which AI tools are used where and how they affect cost, risk and productivity. This is enablement, not surveillance. If P&L impact is the goal, the first question is not “Which model?”. It is: “Where is value already emerging and how quickly can we capture it?”
Quantifying the productivity lift
The productivity story about AI is no longer anecdotal. Large studies show consistent, double-digit gains when people use AI for the right tasks, ~10–45% productivty increase across domains. (Maslej et al., 2025) Two examples illustrate the pattern:
- Customer support (RCT): +14.2% more issues solved per hour across 5,179 agents. The gains appeared quickly and persisted. (Maslej et al., 2025)
- Software development (field & natural experiments): An increase of +26.08% is shown for task completion (4,867 devs) and +12.4% for core coding tasks (187,489 devs). (Maslej et al., 2025)
These gains reach the organisation only when teams track, learn and standardise what works. The best firms do not deploy more AI, they apply it more effectively.
Apply it to your P&L
Define a small set of metrics that show impact: time to first draft, minutes saved per task, accepted suggestions, tasks per hour, response time, resolution rate, rework rate. Track results at task or ticket level. When you can, compare groups or phase the roll-out to see what truly works. Convert operational wins into financial terms. Then standardise the winners and retire the rest. This is the From Signal to ROI message: you are not “doing AI”, you are investing in measurable improvements to throughput, quality and cost. Ciralgo’s AI Adoption Hub gives you one place to track these metrics across all AI use cases instead of chasing them in spreadsheets.
An example:
First-draft summaries drop from 10 minutes to 6 minutes. The quarterly volume is 18,000. That is 4 minutes x 18,000 = 72,000 minutes. At a €55 hourly rate, the time saving is about €66k per quarter. The error rate falls from 3.2% to 2.4% so the rework costs fall by €12k. After licences and support the net win is €68k per quarter. We publish the result, templatise the prompt and retire the duplicate tool.
Checklist
- Pick three live use cases with real volume
- Set one operational and one budget metric for each
- Log accepted suggestions, time to first draft and rework avoided
- Run a two-week staggered roll-out on one case for a clean comparison
- Publish a one-page read-out: keep, widen or kill.Substantiate with financial impact.
Strategic investment for maximum impact
Ask one question in your next planning cycle: if you knew which AI workstreams created 80% of the productivity lift, what would you scale this month? Top performers shorten the path from pilot to production: mid-market leaders move in ~90 days while many enterprises take nine months or more. This valuable time loss erodes both learning and sponsorship within an organisation.
Rank use cases by euros per hour saved (or revenue lift) at meaningful volumes, consolidate overlapping tools to the best performer with the lowest total cost of ownership (TCO) and move budget only when unit economics improve. Protect speed with lightweight, outcome-oriented controls so results are reproducible and issues are quickly mitigated. Scaling is in some way portfolio optimization: double down on what is proven and exit what is merely used.
“AI can deliver 10-45% task-level lift, but if 95% of pilots never reach production, none of it hits your P&L.”
Decide on evidence
The paradox will persist until measurement catches up with ambition. Most pilots do not miss because AI is weak. They miss because we do not measure, attribute and scale what works and stop what does not. The evidence base is finally strong enough to act: studies show 10-45% task-level lift, G7 peers call ROI sizing the number one obstacle and your own employees are already experimenting with AI in the shadows.
Do you want a view within your organisation where to scale and where to save? If you want to see these signals on live data, Ciralgo can give you a tenant-level snapshot of AI usage, cost and impact. Book a 20-min Adoption & Productivity meeting
Sources
- MIT NANDA (2025). The GenAI Divide – State of AI in Business 2025.
- OECD/BCG/INSEAD (2025). The Adoption of Artificial Intelligence in Firms. https://doi.org/10.1787/f9ef33c3-en
- Maslej, N., Fattorini, L., Perrault, R., Gil, Y., Parli, V., Kariuki, N., … Oak, S. (2025). Artificial Intelligence Index Report 2025 (Stanford HAI). https://arxiv.org/abs/2504.07139